Articles
Showing posts by author: OpenObserve Team

Installing Kubelet Stats Receiver with OpenTelemetry
Deploy and configure your Kubelet Stats Receiver with OpenTelemetry using this step-by-step guide.
OpenObserve Team
2 Oct, 2024

Top 8 Open Source Distributed Tracing Tools
Dive into the top open source distributed tracing tools, exploring their features, case uses, and benefits for microservices.
OpenObserve Team
2 Oct, 2024

Using HTTP Event Collector for Splunk Data
Step-by-step process to configure and activate Splunk HEC Receiver for efficient data collection and management.
OpenObserve Team
2 Oct, 2024

Understanding Prometheus Agent Mode and Its Performance
Learn about the Prometheus agent mode, a solution for efficient metric shipping at remote locations, with improved scalability and performance.
OpenObserve Team
2 Oct, 2024

Open Source Log Management Tools for 2024
Our blog provides a detailed overview of top open-source log management tools, stressing on their primary features and usability.
OpenObserve Team
2 Oct, 2024

Setting Up the SQL Server Receiver for OpenTelemetry
Discover the role and setup of SQL Server Receiver within OpenTelemetry for effective monitoring and performance optimization.
OpenObserve Team
2 Oct, 2024

Monitoring Oracle Database Receiver in the Cloud
Learn the importance of monitoring Oracle DB Receiver in cloud environments and converting query results into actionable metrics.
OpenObserve Team
2 Oct, 2024

Top 7 Best Practices for Web Application Monitoring Tools
Discover ways to choose the right web application monitoring tools, monitor user experience, and automate alerts for maximum efficiency.
OpenObserve Team
2 Oct, 2024

How to Monitor Active Directory Domain Services with Dsquery
Learn how to configure Dsquery for effective Active Directory DS Receiver monitoring and schedule regular checks.
OpenObserve Team
2 Oct, 2024

Key Observability Best Practices Every Organization Should Implement
Understand the top 10 observability best practices, including monitoring critical events, standardized data logging, and effective feedback loops.
OpenObserve Team
1 Oct, 2024

OpenTelemetry Architecture: Components, Design, and Overview
Explore OpenTelemetry architecture, its key components and signals including data collection, processing, and context propagation.
OpenObserve Team
1 Oct, 2024
Simple Practices for Easier Log Management and Troubleshooting
Our blog emphasizes on easier logs management and troubleshooting practices like defining clear logging objectives and structured logs.
OpenObserve Team
1 Oct, 2024
Monitoring Practices and Tools for Kubernetes
Discover key methods for monitoring Kubernetes like DaemonSets, Heapster and OpenTelemetry for consistent, comprehensive telemetry data.
OpenObserve Team
1 Oct, 2024

OpenTelemetry Kafka Metrics Monitoring
Learn how to configure Kafka to report metrics to the OpenTelemetry Collector in our in-depth guide for Kafka metrics receiver.
OpenObserve Team
24 Sept, 2024

Zipkin Receiver: Simplifying Distributed Tracing
Receives spans from Zipkin (V1 and V2). Include the Zipkin receiver in the receiver definitions.
OpenObserve Team
13 Sept, 2024

How Dynatrace Works and What it Does?
Dynatrace works by automatically monitoring applications and infrastructure, tracking transactions from browser to database, and examining performance issues.
OpenObserve Team
18 Jul, 2024
New capabilities in AWS APM for elevated observability experience
Discover new capabilities in AWS APM for enhanced observability, such as automatic service discovery and SLO visibility.
OpenObserve Team
18 Jul, 2024
Monitoring Kubernetes Cluster using OpenTelemetry Components
K8s Cluster Receiver is instrumental in aggregating cluster-level metrics and events for efficient Kubernetes monitoring.
OpenObserve Team
18 Jul, 2024
Getting Started with Data Processing Using OpenTelemetry Collector
Get an overview of OpenTelemetry Collector's data processing capabilities, its key components like receivers, processors, exporters and extensions.
OpenObserve Team
18 Jul, 2024

Three Pillars of Observability: Working with Metrics, Logs, and Traces
Metrics is a numeric representation of data over time, providing essential insight into system performance within observability.
OpenObserve Team
18 Jul, 2024
Getting Started with Node.js in OpenTelemetry
OpenTelemetry, an effective observability framework for telemetry data in Node.js applications - tracing, metrics, and logs.
OpenObserve Team
18 Jul, 2024

Benefits of Cloud Scalability for Organizations
Cloud scalability offers cost efficiency, improved performance, enhanced reliability, and robust disaster recovery essential for organizational growth.
OpenObserve Team
29 Jun, 2024

Understanding Elasticsearch Cluster Health Status
Elasticsearch cluster health is significant. It has 3 status colors: green, yellow, red, depicting shard allocation.
OpenObserve Team
29 Jun, 2024

SNMP Trap, OTEL Collector Receiver and Monitoring Basics
The role of OTEL collector receivers in capturing and processing SNMP traps for efficient network management.
OpenObserve Team
29 Jun, 2024

Understanding Real User Monitoring (RUM)
RUM captures user interaction metrics for proactive issue resolution and digital performance improvement. Understand Real User Monitoring.
OpenObserve Team
29 Jun, 2024
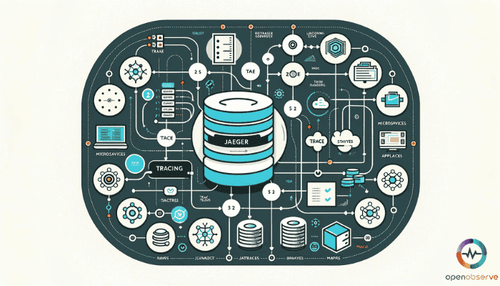
Getting Started with Jaeger Tracing: A Guide
Get started with Jaeger tracing: understand its role in distributed systems and explore the Jaeger UI for better monitoring.
OpenObserve Team
29 Jun, 2024
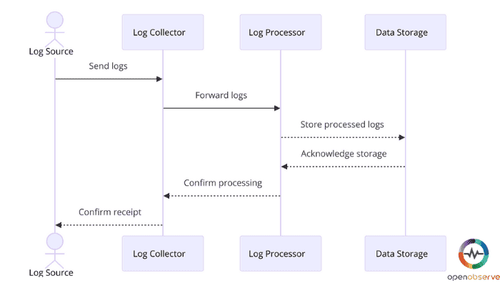
Log Ingestion Basics
Learn the importance of log ingestion in monitoring and security, handling different types like security, system, and application logs.
OpenObserve Team
29 Jun, 2024
Unifying Observability and Troubleshooting: The Power of Observability Dashboards
Discover the importance of unified observability and troubleshooting for cloud-based applications using observability dashboards.
OpenObserve Team
29 Jun, 2024
Discover the Best Open Source Splunk Alternatives for Your Observability Needs
Explore the top open source Splunk alternatives like OpenObserve, SigNoz and Logstash. Compare to find the best fit for your observability needs.
OpenObserve Team
29 Jun, 2024
Top Practices for SaaS Monitoring Tools
Discover key steps in choosing the right SaaS monitoring tools: consider type of application, performance requirements, and user experience.
OpenObserve Team
29 Jun, 2024

Introduction to SPA Monitoring System for Single Page Application
Get an overview of SPA Monitoring, its importance in monitoring single page applications, and its eminent advantages for developers.
OpenObserve Team
29 Jun, 2024

Getting Started with Open Source Tracing: Jaeger vs. Zipkin
Our blog compares Zipkin and Jaeger, leading tools for open-source, distributed tracing in modern software development.
OpenObserve Team
29 Jun, 2024

Exploring Prometheus Metrics Types
Unravel the four core Prometheus metric types - Counter, Gauge, Histogram, Summary - their role in system monitoring.
OpenObserve Team
28 Jun, 2024

Observability Pipeline Basics
An observability pipeline manages, optimizes, and analyzes telemetry data, enhancing security and operational efficiency with AI-driven enhancements.
OpenObserve Team
28 Jun, 2024

Understanding OpenTelemetry Protocol (OTLP) Specifications and Metrics
Explore the operational frameworks of OTLP, how it contributes to OpenTelemetry data models, and its evolving nature within the OpenTelemetry project.
OpenObserve Team
27 Jun, 2024

Getting Started with Splunk Search Queries Tutorial
Our Splunk search tutorial provides step-by-step instructions on creating search queries, refining searches with Boolean operators.
OpenObserve Team
27 Jun, 2024

Basics of Scaling Your Software Architecture
Learn the essentials of scaling architecture and master principles and best practices for resilient systems.
OpenObserve Team
26 Jun, 2024

OSquery for Beginners and Experts: Installation, Tips, and Techniques
Uncover osquery, a versatile system monitoring framework that transforms your OS into a queryable relational database, enhancing security and insights.
OpenObserve Team
26 Jun, 2024
Getting Started with OpenTelemetry Collector
Get started with OTEL collector: setup the environment, generate and collect telemetry, explore components, and apply custom configurations.
OpenObserve Team
24 Jun, 2024

Session Replay Insights: Your Key to Unlocking a Seamless User Journey
Boost your website's UX with session replay software. Identify issues, optimize conversions, and enhance support for better performance.
OpenObserve Team
24 Jun, 2024

How OpenTelemetry Works and Its Use Cases
Explore how OpenTelemetry works, providing standardized collection and analysis of telemetry data like logs, metrics, and traces.
OpenObserve Team
17 Jun, 2024
Prometheus vs. Grafana: In-Depth Comparison & Differences
Prometheus vs Grafana: Learn how both of these tools compare in crucial metrics like features, data collection and storage, UI, and more.
OpenObserve Team
22 Apr, 2024
Solutions
Company
Resources
Pricing

OpenObserve Inc. © 2025
3000 Sand Hill Rd Building 1, Suite 260, Menlo Park, CA 94025