Resources
Showing posts for category: observability

Understanding Tools for Cloud Native Observability
Explore cloud native observability with components like APM, Distributed Tracing, and tools like Prometheus and Jaeger.
OpenObserve Team
1 Oct, 2024

Mastering Microservices Monitoring: The Best Tools for 2024
Dive into the essentials of microservices monitoring tools, covering prominence of observability, alert balance and performance identification.
OpenObserve Team
29 Jun, 2024

Navigating Observability: Logs, Metrics, and Traces Explained
Explore the three pillars of observability—logs, metrics, and traces. Learn how they interact to provide deep system visibility and drive performance.
OpenObserve Team
29 Jun, 2024

Empower Your Enterprise With The Top Open-Source Logging Systems for 2024
Uncover top open source logging tools of 2024, with a focus on flexibility, cost-effectiveness, comprehensive features, and support.
OpenObserve Team
27 Jun, 2024

Understanding Prometheus Architecture Details
Learn about the pull-based model for metrics collection pivotal to Prometheus architecture and its components like Server, Exporters, Alertmanager.
OpenObserve Team
27 Jun, 2024

Using Prometheus APM Tools for Asset Performance Management
Learn how to optimize asset performance using Prometheus and OpenObserve for real-time monitoring and dynamic dashboard visualization
OpenObserve Team
21 May, 2024

Deploying Grafana with Helm Charts in Kubernetes
Simplify Grafana deployment in Kubernetes with Helm Charts. Gain insights & manage data visualizations effectively
OpenObserve Team
30 Apr, 2024
Key Observability Best Practices Every Organization Should Implement
Understand the top 10 observability best practices, including monitoring critical events, standardized data logging, and effective feedback loops.
OpenObserve Team
1 Oct, 2024
New capabilities in AWS APM for elevated observability experience
Discover new capabilities in AWS APM for enhanced observability, such as automatic service discovery and SLO visibility.
OpenObserve Team
18 Jul, 2024
Getting Started with Data Processing Using OpenTelemetry Collector
Get an overview of OpenTelemetry Collector's data processing capabilities, its key components like receivers, processors, exporters and extensions.
OpenObserve Team
18 Jul, 2024

Three Pillars of Observability: Working with Metrics, Logs, and Traces
Metrics is a numeric representation of data over time, providing essential insight into system performance within observability.
OpenObserve Team
18 Jul, 2024
Unifying Observability and Troubleshooting: The Power of Observability Dashboards
Discover the importance of unified observability and troubleshooting for cloud-based applications using observability dashboards.
OpenObserve Team
29 Jun, 2024
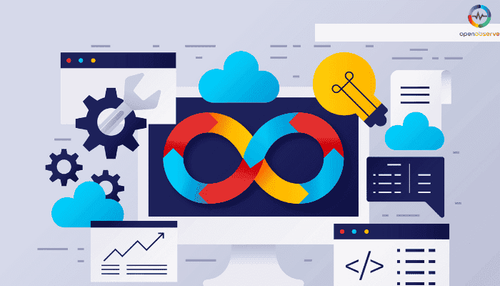
Discover the Best Open Source Splunk Alternatives for Your Observability Needs
Explore the top open source Splunk alternatives like OpenObserve, SigNoz and Logstash. Compare to find the best fit for your observability needs.
OpenObserve Team
29 Jun, 2024

Observability Pipeline Basics
An observability pipeline manages, optimizes, and analyzes telemetry data, enhancing security and operational efficiency with AI-driven enhancements.
OpenObserve Team
28 Jun, 2024

Basics of Scaling Your Software Architecture
Learn the essentials of scaling architecture and master principles and best practices for resilient systems.
OpenObserve Team
26 Jun, 2024
Getting Started with OpenTelemetry Collector
Get started with OTEL collector: setup the environment, generate and collect telemetry, explore components, and apply custom configurations.
OpenObserve Team
24 Jun, 2024
Solutions
Company
Resources
Pricing
OpenObserve Inc. © 2025
3000 Sand Hill Rd Building 1, Suite 260, Menlo Park, CA 94025
